Portal Features
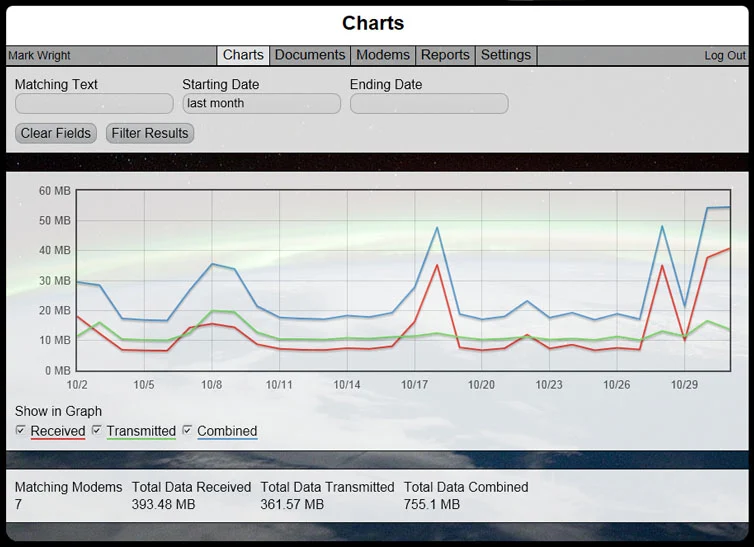
- Graphical bar charts that display usage (received/transmitted/combined) over any period of time
- Historical usage, broken up into time slices to narrow in on problem high-usage times
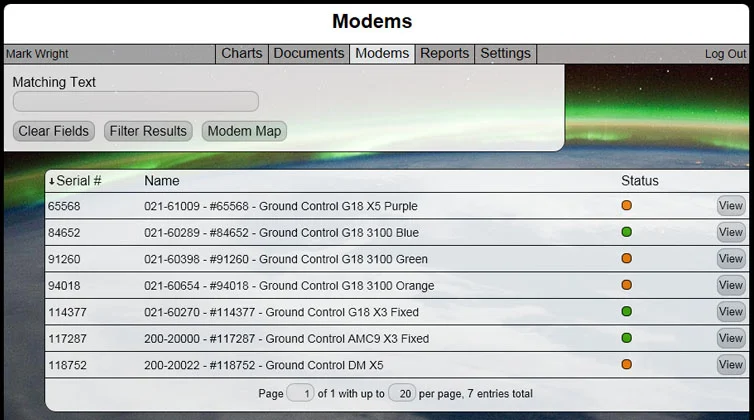
- List of satellite modems with online status light – quick one-button detail view of any system
- Detailed single-system bandwidth usage reports TCP Rx/Tx, UDB Rx/Tx, Other Rx/Tx
- Modem Settings – Static IP, Netmask, Usable IP addresses, DHCP enabled/disabled, Max Speeds, CIR
- Current Activity – Signal-to-noise ratio and bar chart that shows data transfer speeds over last two hours
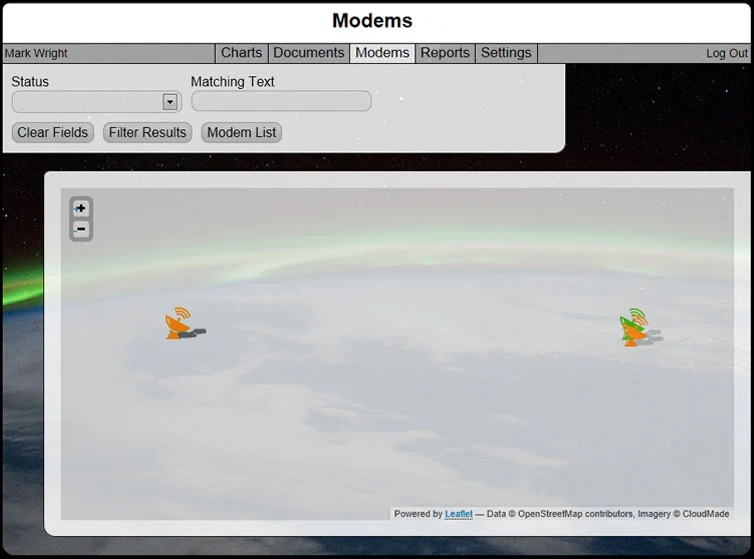
- Current Location – GPS location shows VSAT location on map (Google Maps)
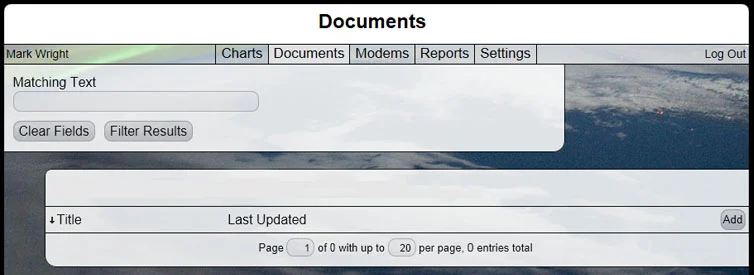
- Important documents and files download page
- Communication Errors – time-stamped LLC and SCPC errors
- Connection quality graph – signal-to-noise ratio over the last two hours
- Power level graph – shows transmitter and receiver power in dBm over the last two hours
- Reports – Download daily modem usage or modem usage summery from any time span – All systems – Excel .CSV file
- Portal User Profile – Update account settings such as name and password
Portal Screenshots

Would you like to know more?
If you're interested in our iDirect service for high speed satellite internet, with or without our Toughsat hardware, please call or email us, or complete the form.
We have 20 years' experience in delivering high-speed internet for emergency responders, military, media, businesses and individuals, so you're in safe hands.
We have 20 years' experience in delivering high-speed internet for emergency responders, military, media, businesses and individuals, so you're in safe hands.